Table of contents
Learn WebGL and Babylon.js at your own pace
Feel free to check out our online course 3D Programming with WebGL and Babylon.js for Beginners on Zenva Academy. The course covers the Babylon.js framework and explains all you need to get started with using this fantastic library in new or existing projects.
Tutorial
Windows 8.1 added the support of WebGL for Internet Explorer and JavaScript applications. This is a huge evolution because we are now able to unleash the raw power of the GPU even with HTML5 and JavaScript!
This power can be tricky to master and that’s why I created babylon.js. And using it, the wonderful world of accelerated 3D will welcome you.
Preparing the project
For instance, I always wanted to create an app to have my blog’s statistics at a glance.
If you want to get the final application, you can download the complete project here (127KB)
To do so, let’s start with a empty Windows 8.1 JavaScript app.

The first thing is to reference babylon.js (and hand.js for supporting touch events):

The default.html page should be changed to add a canvas and to reference babylon.js and hand.js:
<!DOCTYPE html>
<html>
<head>
    <meta charset="utf-8" />
    <title>Chart3D</title>

    <!-- WinJS references -->
    <link href="//Microsoft.WinJS.2.0.Preview/css/ui-dark.css" rel="stylesheet" />
    <script src="//Microsoft.WinJS.2.0.Preview/js/base.js"></script>
    <script src="//Microsoft.WinJS.2.0.Preview/js/ui.js"></script>

    <!-- Chart3D references -->
    <link href="/css/default.css" rel="stylesheet" />
    <script src="js/hand.minified-1.1.1.js"></script>
    <script src="js/babylon.js"></script>
    <script src="/js/default.js"></script>
</head>
<body>
    <canvas id="renderCanvas"></canvas>
</body>
</html>
Connecting babylon.js
As you may have seen in my previous posts, babylon.js needs to connect with the canvas through the BABYLON.Engine object. We can do that right after the completion of the processAll function:
args.setPromise(WinJS.UI.processAll().then(function() {
                var canvas = document.getElementById("renderCanvas");
                var engine = new BABYLON.Engine(canvas, true);
Then we have to create some entities required to generate a complete scene:
var scene = new BABYLON.Scene(engine);
var light = new BABYLON.DirectionalLight("dir01", new BABYLON.Vector3(0, -0.5, 1.0), scene);
var camera = new BABYLON.ArcRotateCamera("Camera", 0, 0, 10, BABYLON.Vector3.Zero(), scene);
camera.setPosition(new BABYLON.Vector3(20, 70, -100));
light.position = new BABYLON.Vector3(0, 25, -50);
The scene, a light and a camera to define the user’s point of view. Nothing special here.
Finally we have to connect the camera with the canvas (to allow the user to control the camera) and launch the render loop:
// Render
camera.attachControl(canvas);

engine.runRenderLoop(function () {
    scene.render();
});

// Resize
window.addEventListener("resize", function () {
    engine.resize();
});
Creating the ground and the background
If we launch our app right now, it will be a little bit empty. Indeed there is nothing to display 
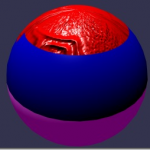
Let’s add the ground and the background to create something like this:

The ground will be generated with BABYLON.Mesh.CreateGround (!!) and the background with BABYLON.Mesh.CreatePlane:
var playgroundSize = 100;
// Background
var background = BABYLON.Mesh.CreatePlane("background", playgroundSize, scene, false);
background.material = new BABYLON.StandardMaterial("background", scene);
background.scaling.y = 0.5;
background.position.z = playgroundSize / 2 - 0.5;
background.position.y = playgroundSize / 4;

var backgroundTexture = new BABYLON.DynamicTexture("dynamic texture", 512, scene, true);
background.material.diffuseTexture = backgroundTexture;
background.material.specularColor = new BABYLON.Color3(0, 0, 0);
background.material.backFaceCulling = false;

backgroundTexture.drawText("Eternalcoding", null, 80, "bold 70px Segoe UI", "white", "#555555");
backgroundTexture.drawText("- browsers statistics -", null, 250, "35px Segoe UI", "white", null);

// Ground
var ground = BABYLON.Mesh.CreateGround("ground", playgroundSize, playgroundSize, 1, scene, false);
var groundMaterial = new BABYLON.StandardMaterial("ground", scene);
groundMaterial.diffuseColor = new BABYLON.Color3(0.5, 0.5, 0.5);
groundMaterial.specularColor = new BABYLON.Color3(0, 0, 0);
ground.material = groundMaterial;

ground.position.y = -0.1;
The main point to note here is the usage of a BABYLON.DynamicTexture: This object allows you to draw in a texture with a canvas. There are also some handy functions like drawText to simplify complex tasks. Instead of using drawText you could have written the following code (just for the sake ofcomprehension):
 BABYLON.DynamicTexture.prototype.drawText = function (text, x, y, font, color, clearColor, invertY) {
     var size = this.getSize();
     if (clearColor) {
         this._context.fillStyle = clearColor;
         this._context.fillRect(0, 0, size.width, size.height);
     }

     this._context.font = font;
     if (x === null) {
         var textSize = this._context.measureText(text);
         x = (size.width - textSize.width) / 2;
     }

     this._context.fillStyle = color;
     this._context.fillText(text, x, y);

     this.update(invertY);
 };
As you can see this is a regular 2D canvas code.
Adding the series’ data
Now it is time to add some data to display. For not complicating things up, we will consider static data but obviously you are free to use dynamic data:
var browsers_Series = [
    { label: "IE", value: 32, color: new BABYLON.Color3(0, 0, 1) },
    { label: "Chrome", value: 28, color: new BABYLON.Color3(1, 0, 0) },
    { label: "Firefox", value: 16, color: new BABYLON.Color3(1, 0, 1) },
    { label: "Opera", value: 14, color: new BABYLON.Color3(1, 1, 0) },
    { label: "Safari", value: 10, color: new BABYLON.Color3(0, 1, 1) }
];
Every entry is composed of a label, a value (which is a percentage) and a color.
To display them, we have to add a new function in our code:
var createSeries = function (series) {
    var margin = 2;
    var offset = playgroundSize / (series.length) - margin;
    var x = -playgroundSize / 2 + offset / 2;

    for (var index = 0; index < series.length; index++) {
        var data = series[index];

        var bar = BABYLON.Mesh.CreateBox(data.label, 1.0, scene, false);
        bar.scaling = new BABYLON.Vector3(offset / 2.0, data.value * scale, offset / 2.0);
        bar.position.x = x;
        bar.position.y = data.value * scale / 2.0;

        // Material
        bar.material = new BABYLON.StandardMaterial(data.label + "mat", scene);
        bar.material.diffuseColor = data.color;
        bar.material.emissiveColor = data.color.scale(0.3);
        bar.material.specularColor = new BABYLON.Color3(0, 0, 0);

        // Going next
        x += offset + margin;
    }
};
For each entry, we create a box associated with a colored material. The box is then scaled depending on the entry’s value. The result is the following screen:

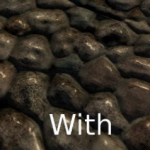
Shadows
The previous screen may look a bit flat. We can improve things up by adding dynamic shadows.
Real-time shadows are complex to produce (you need to create a shadow map and then use it in your shaders). But with babylon.js, you just have to create a BABYLON.ShadowGenerator and define which objects cast shadows and which objects receive shadows:
// Shadows
var shadowGenerator = new BABYLON.ShadowGenerator(1024, light);
ground.receiveShadows = true;
background.receiveShadows = true;
To cast shadows, boxes must be added to the shadowGenerator object:
shadowGenerator.getShadowMap().renderList.push(bar);
The result is more beautiful, isn’t it?

Adding the legend
There is an issue with our chart: no one can say the value and the associated label of each box. That is why we need to add a legend.
Every box will be associated with a small plane with a dynamic texture filled with the label and the value of the current entry:

To do so, we have to update our createSeries function in order to generate a legend for each entry:
// Legend
var barLegend = BABYLON.Mesh.CreateGround(data.label + "Legend", playgroundSize / 2, offset * 2, 1, scene, false);
barLegend.position.x = x;
barLegend.position.z = -playgroundSize / 4;
barLegend.rotation.y = Math.PI / 2;

barLegend.material = new BABYLON.StandardMaterial(data.label + "LegendMat", scene);
var barLegendTexture = new BABYLON.DynamicTexture("dynamic texture", 512, scene, true);
barLegendTexture.hasAlpha = true;
barLegend.material.diffuseTexture = barLegendTexture;
barLegend.material.emissiveColor = new BABYLON.Color3(0.4, 0.4, 0.4);

var size = barLegendTexture.getSize();
barLegendTexture.drawText(data.label + " (" + data.value + "%)", 80, size.height / 2 + 30,
                                       "bold 50px Segoe UI", "white", "transparent", false);
Sprinkling a bit of animations
Finally for the “waoouh” effect, I suggest we can animate the boxes: They will start with a 0 height and they will grow up to their effective value:
var bar = BABYLON.Mesh.CreateBox(data.label, 1.0, scene, false);
bar.scaling = new BABYLON.Vector3(offset / 2.0, 0, offset / 2.0);
bar.position.x = x;
bar.position.y = 0;

// Animate a bit
var animation = new BABYLON.Animation("anim", "scaling", 30, BABYLON.Animation.ANIMATIONTYPE_VECTOR3);
animation.setKeys([
    { frame: 0, value: new BABYLON.Vector3(offset / 2.0, 0, offset / 2.0) },
    { frame: 100, value: new BABYLON.Vector3(offset / 2.0, data.value * scale, offset / 2.0) }]);
bar.animations.push(animation);

animation = new BABYLON.Animation("anim2", "position.y", 30, BABYLON.Animation.ANIMATIONTYPE_FLOAT);
animation.setKeys([
    { frame: 0, value: 0 },
    { frame: 100, value: (data.value * scale) / 2 }]);
bar.animations.push(animation);
scene.beginAnimation(bar, 0, 100, false, 2.0);
You can note that we create two animations: one for the scaling and one for the position (the pivot of each box is in the middle of the mesh). Thescene.beginAnimation is then used to launch to animation.
Nothing complex here but a cool effect for the user
Conclusion
If you want to go further, you can consider embedding this code in a control and work with dynamic data to achieve a really mind-lowing way to display data.